Opening the Black Box of Offline Retail — Mobile Scan Customer Analytics
Problem
E-commerce teams know exactly what customers clicked, how long they browsed, and why they abandoned their carts. But offline store teams only see what sold — not what customers considered, compared, or walked away from. A significant share of retail sales still happen in physical stores, yet these stores remain a data blind spot.
Solution
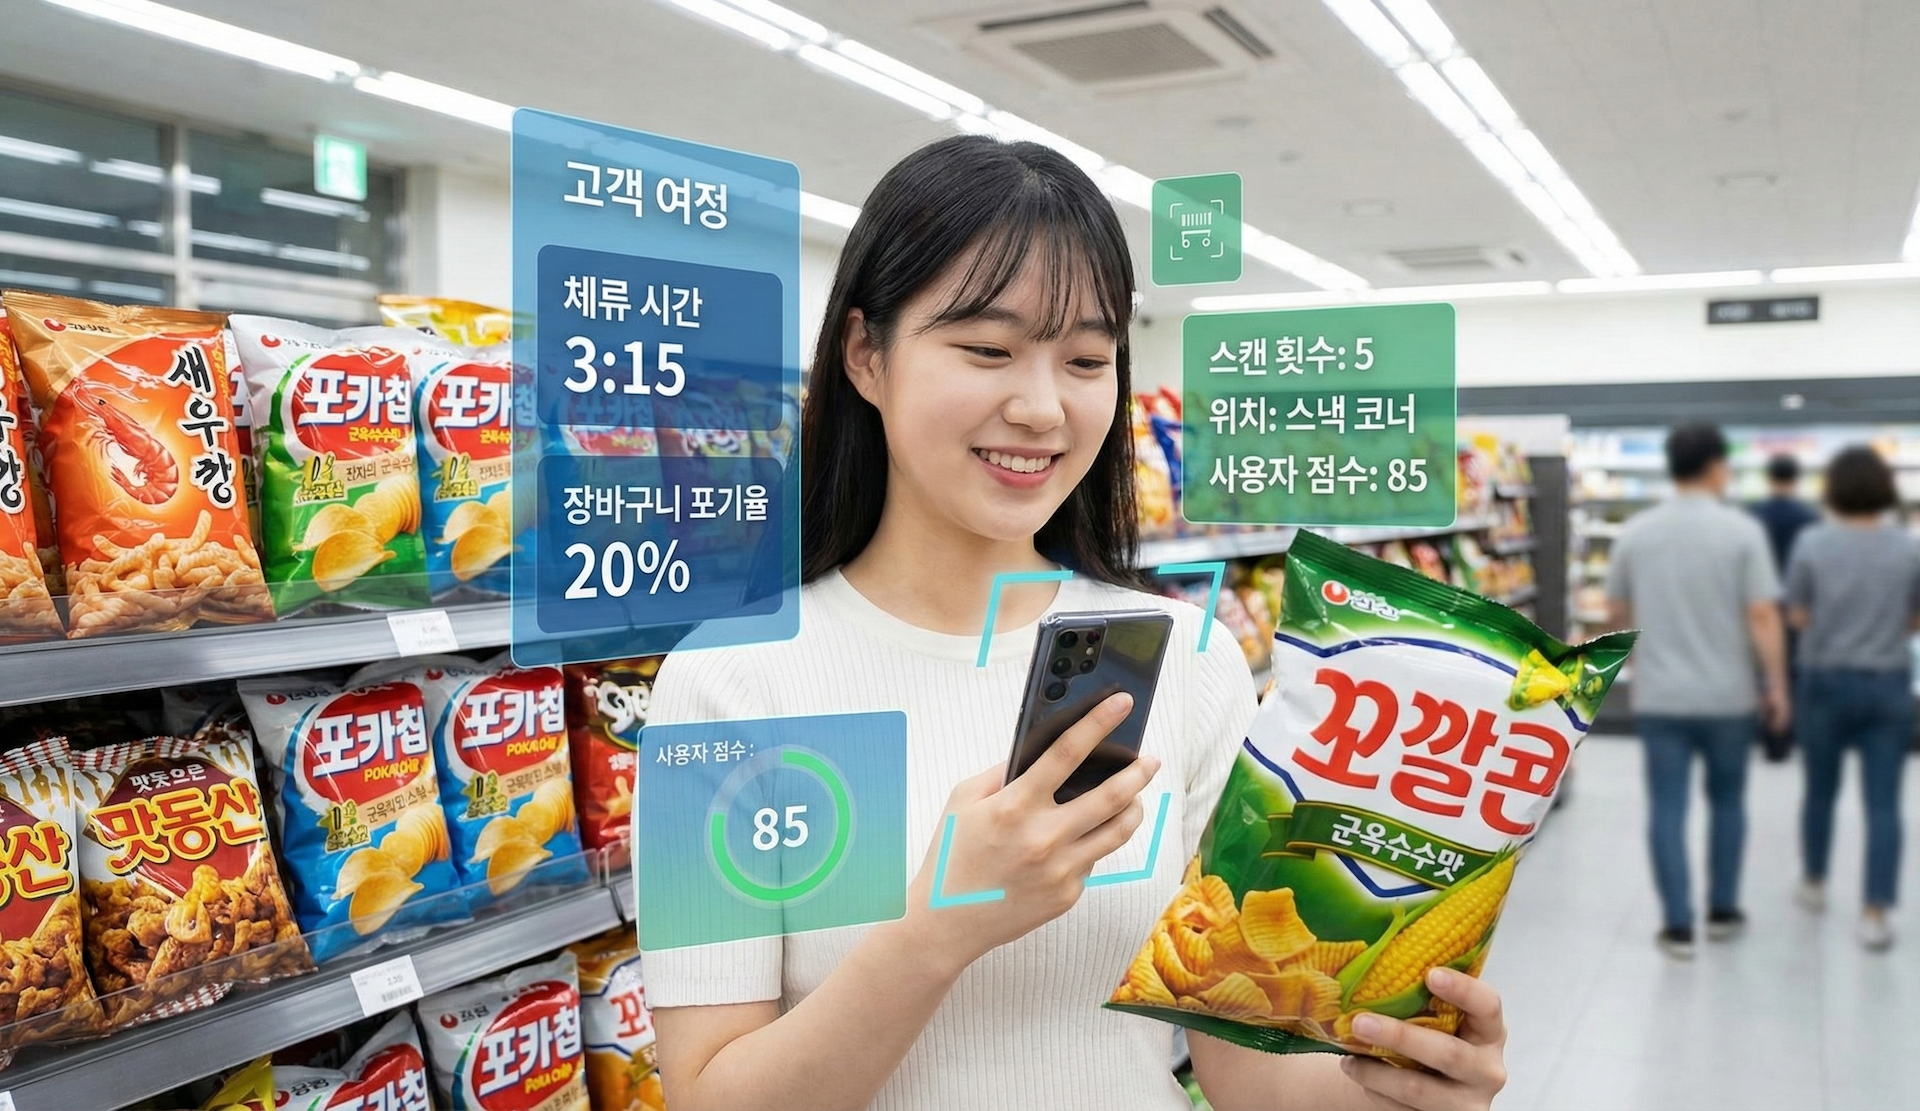
Mobile barcode scanning (Scan & Go) turns every product scan into clickstream data. Dwell time, cart abandonment rates, in-store navigation patterns, product comparison behavior — e-commerce-grade behavioral analytics become possible in physical stores.
Outcome
- Average basket size increase of 14% (MishiPay case study)
- Real-time friction detection by aisle to eliminate revenue bottlenecks
- New revenue stream via Retail Media Network (RMN)
- Walmart launched a business selling store data to suppliers
What E-Commerce Teams Have That Offline Store Teams Don't
Ask any e-commerce marketer: "What was the most viewed product last month that didn't convert to a purchase?"
They'll answer in one second. Google Analytics, Meta Business Suite — there's no shortage of tools.
Now ask the same question to an offline store operations team: "What product did customers pick up the most but put back on the shelf last month?"
Nobody knows.
A significant share of retail revenue still comes from physical stores. Yet everything that happens in-store is invisible until a customer reaches the POS terminal. What they considered, where they hesitated, why they left empty-handed — none of this makes it into the data.
In e-commerce terms, offline stores can only see the very last step of the conversion funnel.
Why Previous Attempts Fell Short
Attempts to solve this problem go back years. But existing technologies all hit the same wall.
- CCTV & video analytics — Can count foot traffic, but can't tell you which products a customer was interested in. Privacy regulations are also a growing concern.
- Wi-Fi & BLE beacons — Location accuracy of 3-5 meters. Knows "customer was near the snack aisle," but not "which products they compared."
- RFID tags — Effective in fashion, but tagging every item in grocery or consumer goods is economically impractical.
- POS data — Only records products that "survived" to checkout. Products picked up and put back, items compared but not purchased — none of this exists in the data.
The core problem: Existing technologies can tell you "who was where" but cannot answer "why didn't they buy?"
But Walmart Already Found the Answer
In February 2026, the world's largest retailer Walmart (annual revenue $713B) officially launched Scintilla In-Store. Built by Walmart Data Ventures — a dedicated data business unit — the platform provides real-time inventory data, shelf status, and product placement information to supplier field representatives through a mobile app.
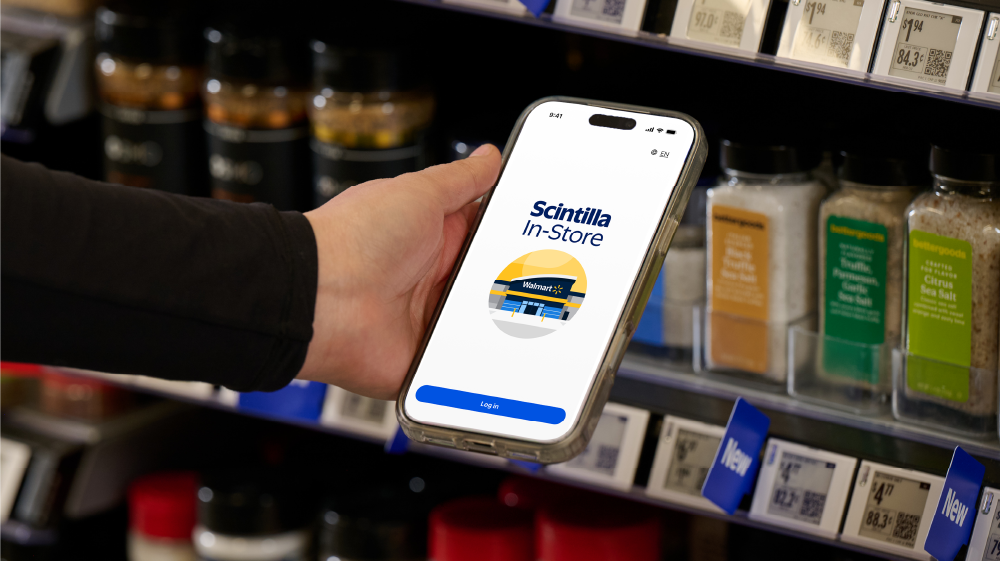
In plain terms: Walmart is now selling "what happens inside the store" as a data product to its suppliers.
Coca-Cola is already a customer. Pamela Stewart, North America Chief Customer Officer at The Coca-Cola Company, said:
Scintilla In-Store is redefining our operations in Walmart stores. The enhanced app experience provides real-time inventory visibility and equips our representatives with advanced tools, enabling them to make data-driven decisions during every store visit.
This isn't a pilot experiment. Walmart acquired Volt Systems in 2022 and spent four years of strategic investment before rebranding it as Scintilla and scaling it as a formal business. AI-driven prioritization is already announced as the next phase.
So how exactly is this data created?
The Core Principle: Scan = Click
Mobile scanning solves this problem in a fundamentally different way. The act of scanning a product barcode with a smartphone becomes data itself.
In e-commerce, clicking a product registers as "interest." In offline retail, scanning a barcode is the physical equivalent of that click. From this single action, the following data is automatically generated:
| E-Commerce Metric | Scan-Based Offline Metric |
|---|---|
| Pageview (product view) | Barcode scan (product view) |
| Dwell time (time on page) | Time between scan and next action |
| Add to cart | Scan then add to checkout list |
| Cart abandonment | Scanned but not purchased |
| Navigation path (clickstream) | In-store route based on scan sequence |
| A/B testing | Different promotions by customer segment |
This is the key insight. Match scan data with POS payment data, and e-commerce-grade funnel analysis becomes possible in physical stores.
Just as e-commerce analytics tools detect "rage clicks" to uncover UX problems, scan data enables an equivalent Friction Score for offline stores. If a customer repeatedly scans products in the same category without adding anything to their cart, that signals choice paralysis or price resistance. If they backtrack to aisles they already passed, that's a navigation failure. Display these scores by aisle on a dashboard, and store operations teams can see for the first time where and why revenue is leaking.
How Much of a Difference Does It Make
14% Basket Size Increase
European Scan & Go solution MishiPay ran A/B tests with a major grocery chain and found that customers using the scan app had average basket sizes 14% larger than non-users. Without checkout line anxiety, shopping time increased, leading to more product exploration.
"Customers Who Viewed This Also Bought" — Now in Physical Stores
Tesco combined in-store scan data with Clubcard purchase history to build a real-time recommendation system. When a customer scans pasta, the system instantly suggests complementary sauces and wines based on past purchases. This feature — taken for granted in e-commerce — is finally working in physical stores.
When Your Store Becomes an Ad Platform — Retail Media Networks
The story doesn't end with cost savings. Scan data can become a revenue-generating engine.
When a customer scans a specific toothpaste at the dental care aisle, a competing brand's promotion appears on their app screen. If they tap it, scan the competitor's product, and complete the purchase — the entire journey is tracked end-to-end.
This is the Retail Media Network (RMN):
- For CPG brands: A channel that clearly proves return on ad spend (ROAS)
- For retailers: A new revenue stream selling in-store ad space at premium rates
- For customers: Real-time discounts on products they're already interested in
Customers standing in front of a shelf are at peak purchase intent. Conversion rates for these ads far exceed any online display advertising. This is precisely why Walmart runs Scintilla as a dedicated business unit.
The Window of Opportunity for Korean Retail
Walmart's move sends a clear signal.
With mobile scanning, every product scan becomes clickstream data — dwell time, cart abandonment rates, navigation patterns, product comparison behavior. E-commerce-grade behavioral analytics become possible in physical stores. Global case studies report a 14% average basket size increase and real-time friction detection that eliminates revenue bottlenecks by aisle.
Store data doesn't stop at being an "internal optimization tool." It is a product that generates revenue on its own.
Korea already has the infrastructure to seize this opportunity: world-leading smartphone penetration, best-in-class mobile payment infrastructure, and major retailers operating tens of thousands of stores nationwide — hypermarkets, convenience store chains, and health & beauty specialty stores.
Yet no player in Korea is systematically collecting and monetizing in-store behavioral data.
Consider this:
- What if a major hypermarket could offer global CPG brands data on "how long customers deliberate in front of your brand's shelf before walking away"?
- What if a health & beauty retailer could sell cosmetics brands a list of "most-scanned SKUs that never convert to purchase"?
- What if a convenience store chain could provide food manufacturers a monthly subscription report on "customer dwell time and conversion rate by shelf position"?
This is exactly what Walmart is doing right now. And in Korea, nobody has started yet.
The first-mover opportunity is wide open. But with global retailers setting the standard as we speak, that window is closing fast.
How to Get Started
The data blind spot in offline retail is no longer an unsolvable problem. The combination of mobile scanning and data analytics is already proven in global retail — and Walmart has turned it into a business.
Getting started is simpler than you think:
- Use existing smartphones — Integrate a software SDK without new hardware investment
- Select pilot stores — Start collecting data in 1-2 locations
- Define core KPIs — Prioritize metrics like scan conversion rate, aisle-level abandonment, and navigation patterns
- Design data monetization — Leverage collected data on two tracks: internal optimization and supplier insight sales
What's taken for granted in e-commerce is becoming possible in physical retail. The first key to opening your store's black box is already in your customers' hands. The question isn't technology — it's who moves first.
Data Connect is an official SCANDIT partner, designing mobile scan-based customer analytics solutions optimized for retail and fashion store environments. Start a conversation through our Contact page.
FAQ
Related Posts
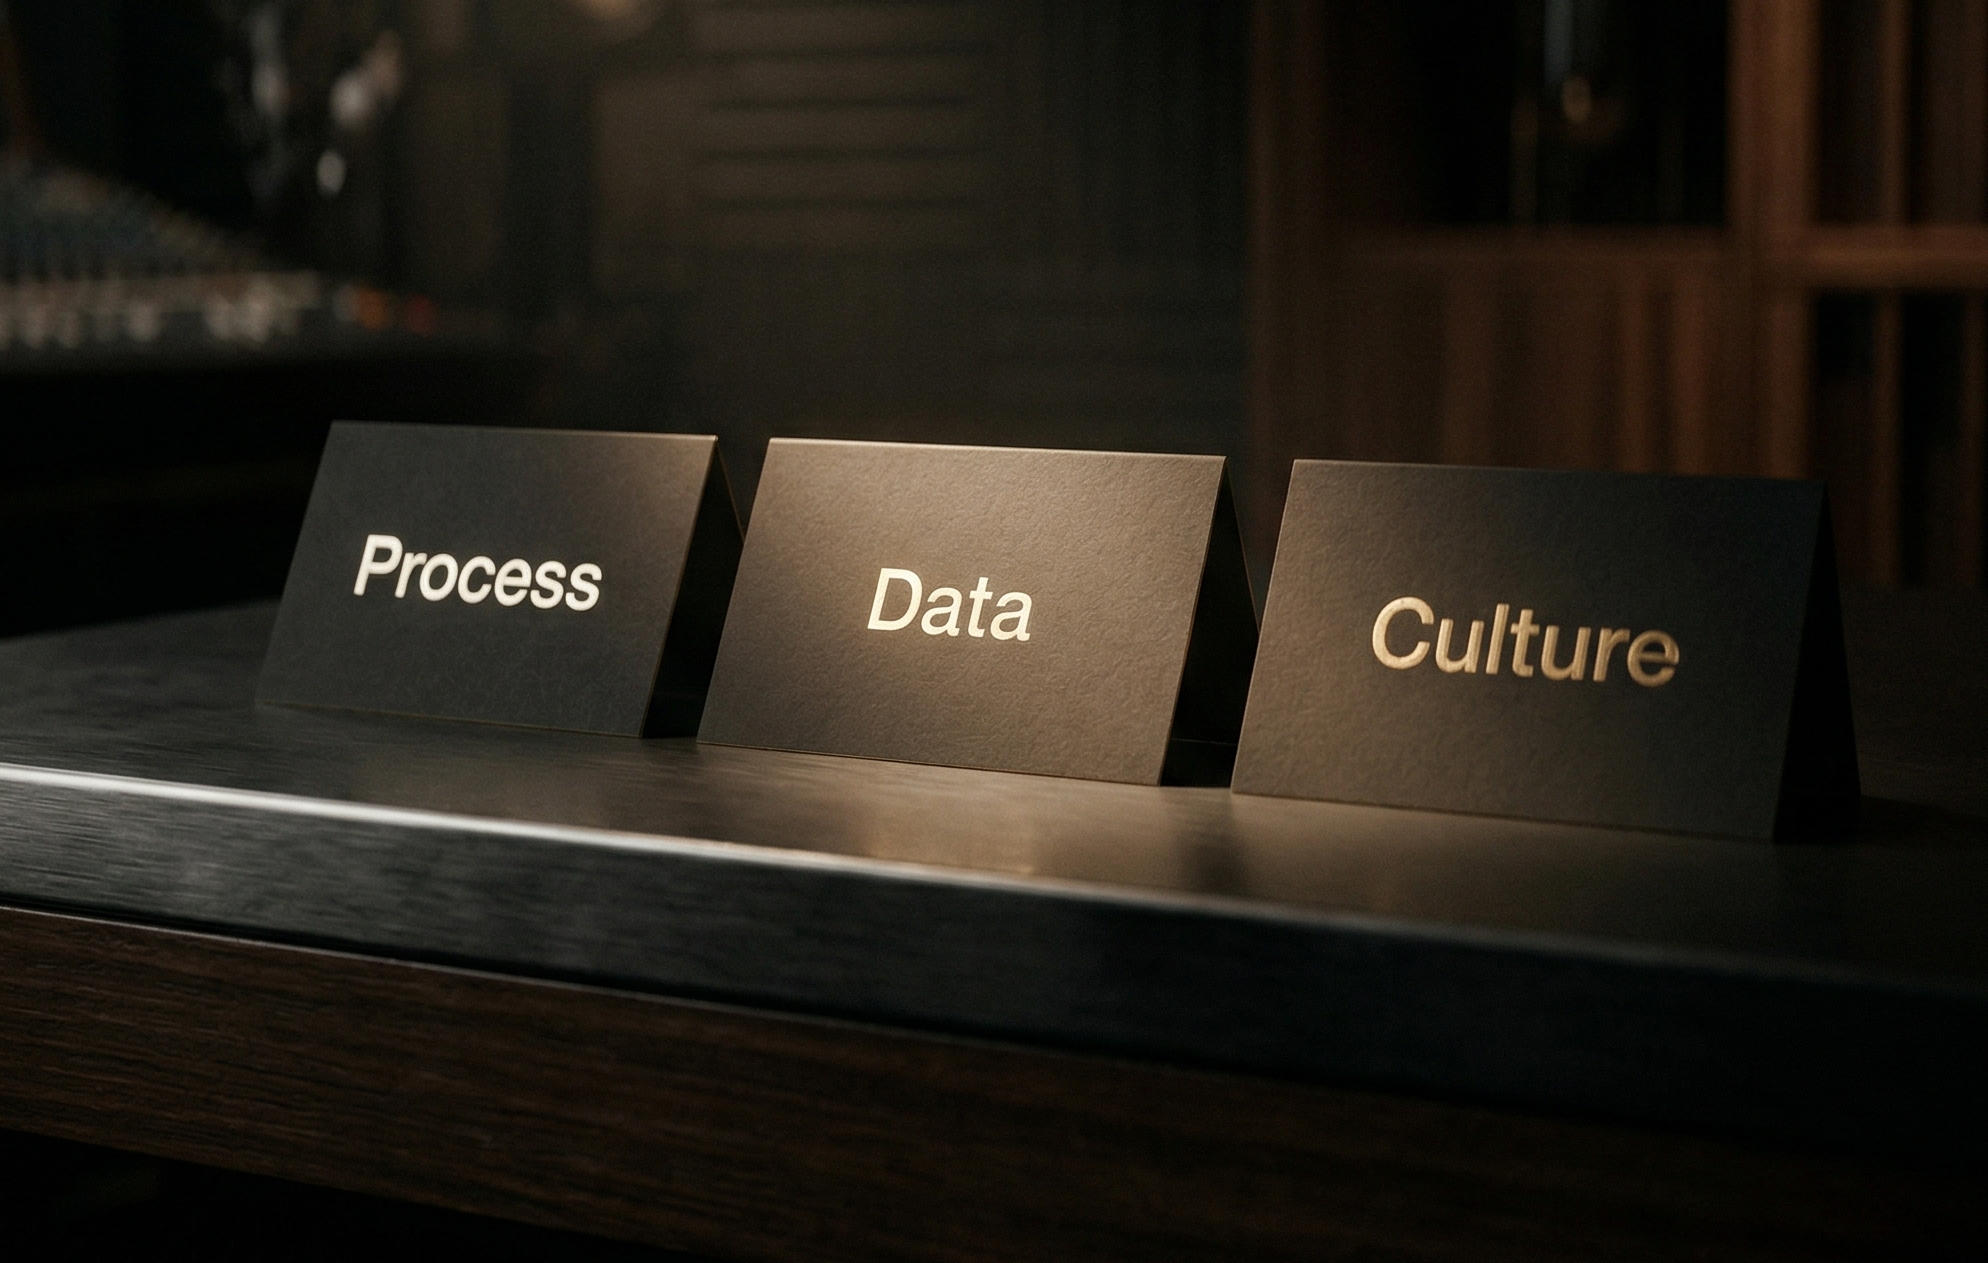
3 Things More Important Than Technology in AI Adoption
85% of enterprises are adopting AI, but only 39% see measurable results. Here are the three conditions that actually determine whether technology creates value — from the field.
Manufacturing AI Precision Is Determined by Shopfloor Data
80% of AI projects fail, and 70% of those failures trace back to data quality. Automating data touchpoints from receiving to shipping is the prerequisite for AX success.

Manufacturing AI: Where Should You Actually Start?
More manufacturers are pouring millions into robot and digital twin POCs — only to see them collapse at the pilot stage. Here's why AX without DX fails, and where the real starting point is.